LM-79 Moving Detector Goniophotometer (Mirror Type C)
LSG-6000

High Precision Rotation Luminaire Goniophotometer
LSG-1890B

High Precision Rotation Luminaire Goniospectroradiometer
LSG-1890BCCD

Goniophotometer for Automotive and Signal Lamps
LSG-1950

Goniophotometer for Traffic Signal Lamps
LSG-1950S

Compact Goniophotometer
LSG-1200A

Near Field Moving Detector Goniophotometer
LSG-1900B


Select an organization
to browse standards
The spectrum analyzer is a high-precision instrument specifically designed for measuring the spectral characteristics of electrical signals. By converting signals into spectrum graphs, users can visually understand the signal’s spectral density and conduct in-depth signal analysis based on frequency distribution.
Operating Principle
At the core of a spectrum analyzer lies the principle of Fourier Transform, a mathematical method that converts a time-domain signal into its frequency-domain representation. Fourier Transform enables the analysis and synthesis of frequency-domain signals. After the test signal undergoes Fourier Transform, the spectrum analyzer receives and processes these signals to ultimately output corresponding spectrum graphs.
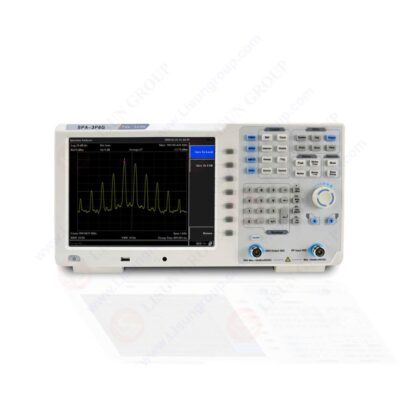
SPA-3P6G Spectrum Analyzer
Main Components of a Spectrum Analyzer
Front-End Interface: This interface receives the signal under test, typically composed of antennas or cables. It converts the signal into electrical signals and transmits them to subsequent processing circuits.
Front-End Amplifier Circuit: Includes high-performance amplifiers and low-noise amplifiers with variable gain. Its primary function is to enhance the input signal and improve the signal-to-noise ratio. Through variable gain control, the spectrum analyzer adjusts the amplification factor of the front-end circuit to accommodate different signal strengths and noise levels.
Fast Fourier Transform (FFT) Circuit: The FFT circuit with windowing functions enhances spectrum analysis, reduces leakage and noise, and improves resolution. It can also analyze interference frequencies and noise-related frequencies in the signal.
Digital Signal Processor (DSP): After FFT processing, the DSP further processes the frequency-domain signal, converting it into a visual spectrum graph that provides detailed signal characteristic information to users.
Features and Applications
The spectrum analyzer can provide detailed parameter outputs including peak values, average power, and spectral density, enabling users to comprehensively understand signal characteristics. Its efficient and intuitive signal analysis capabilities have played a crucial role in scientific research and technical applications.
Summary
In conclusion, the spectrum analyzer is a precision testing instrument based on digital signal processing technology. It rapidly and intuitively analyzes signal characteristics, providing robust support for scientific research and technical applications. Its ability to convert signals into visual representations of spectral data makes it indispensable in various fields requiring detailed signal analysis and measurement.
Your email address will not be published. Required fields are marked *


 English
 中文简体
中文简体 English
 Русский
 Español
 Português
 Türkçe
 العربية
 Deutsch
 Polski
 Italiano
 Français
 한국어
한국어 ไทย
ไทย Tiếng Việt
 日本語
日本語